
pvvMixedTypeName
The function allows you to mix line and column chart graphs by legend name.
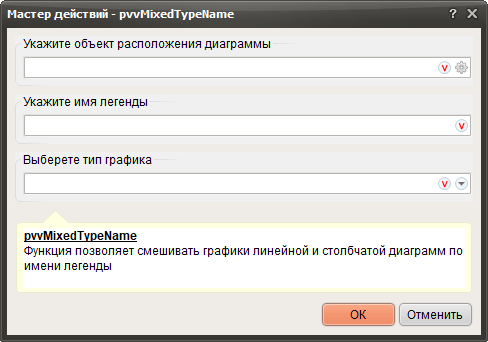
1. Click  and specify the container in which the chart will be created.
2. Enter the legend name.
3. Select the graph type (Line, Column).
and specify the container in which the chart will be created.2. Enter the legend name.
3. Select the graph type (Line, Column).
Bar graphs are mixed with line graphs and vice versa.
|