
pvvScalesXTicksFontLineHeight
The function sets the height of the row along the X axis.
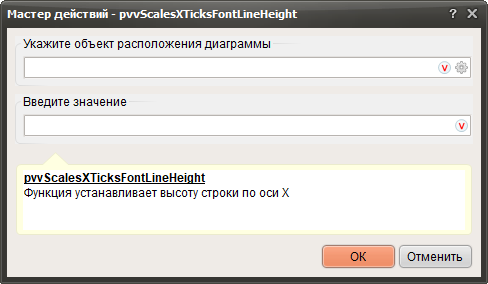
1. Click  and specify the container in which the chart will be created.
2. Enter a value.
and specify the container in which the chart will be created.2. Enter a value.