
pvvScalesYTicksFontWeight
The function sets the boldness of the labels on the Y axis.
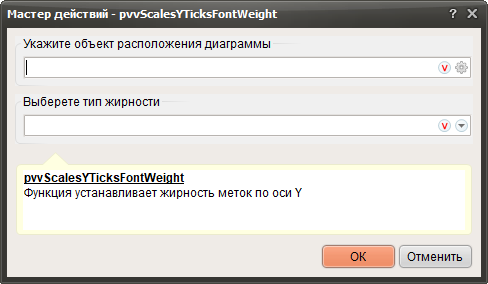
1. Click  and specify the container in which the chart will be created.
2. Select the type of fat content normal, bold, lighter, bolder.
and specify the container in which the chart will be created.2. Select the type of fat content normal, bold, lighter, bolder.