
How to write your own plugin?
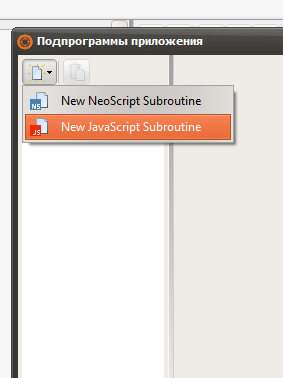
1. Go to 'project -> subroutines' or press 'F12'.
2. Select 'New JavaScript Subroutine'.
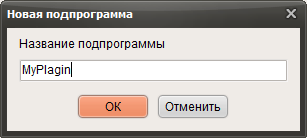
3. Enter a new subroutine name.
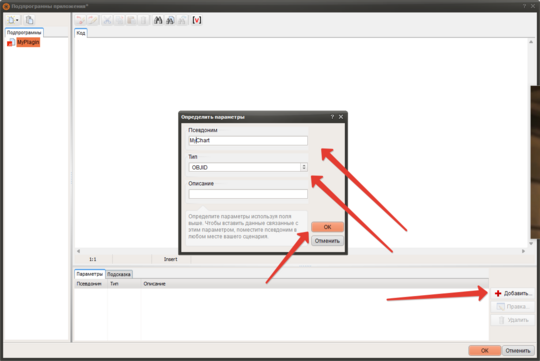
4. Click add, in the window that opens, enter the alias name. In the "Type" field, select the value "OBJID".
2. Select 'New JavaScript Subroutine'.
3. Enter a new subroutine name.
4. Click add, in the window that opens, enter the alias name. In the "Type" field, select the value "OBJID".
/*Check if such chart instance exists if not, returns an error and terminates the subroutine. */ if (!MyChart ) { errorMessage('Enter error text'); return; }; /*this block checks if the chart type matches the bar type if not, returns an error and terminates the subroutine. Bar chart: 'bar' Line chart with areas: 'line' Donut chart: 'doughnut' Pie chart: 'pie' Polar area chart: 'polarArea' Radar chart: 'radar' */ if (MyChart.config.type!=='bar'){ errorMessage('Enter error text'); return; }; /*Create a plugin and put it in a constant*/ const MyPlagin = { id: 'MyPlagin', afterDraw(chart, args, options) { const { ctx } = chart; /*Тут тело Вашего плагина */ ctx.save(); /* save the changes made
ctx.fillStyle ctx.font ctx.textAlign ctx.textBaseline ctx.fillText(); //we output the label */ ctx.restore(); } }; /* We check if there is a plugin block in the graph configuration
if not, we create it */ if (!MyChart .config.plugins) { MyChart .config.plugins = []; }; // Check if this plugin has already been added
const pluginExists = MyChart .config.plugins.some(plugin => plugin.id === MyPlagin.id); if (!pluginExists) { MyChart .config.plugins.push(MyPlagin); }; // Updating the schedule MyChart .update(); |
5. Now go back to the main program editor and add a call to your own subroutine using the function myFunctionChart.
Check out a full example of a plugin that outputs point values and assigns symbols to values
Check out a full example of a plugin that outputs point values and assigns symbols to values
labels = ['%'];
/*Check if such chart instance exists if not, returns an error and terminates the subroutine. */ if (!MyChart ) { errorMessage('Enter error text'); return; }; /*this block checks if the chart type matches the bar type if not, returns an error and terminates the subroutine. Bar chart: 'bar' Line chart with areas: 'line' Donut chart: 'doughnut' Pie chart: 'pie' Polar area chart: 'polarArea' Radar chart: 'radar' */ if (MyChart.config.type!=='bar'){ errorMessage('Enter error text'); return; }; /*Create a plugin and put it in a constant*/ const MyPlagin = { id: 'MyPlagin', afterDraw(chart, args, options) { const {ctx} = chart; chart.data.datasets.forEach((dataset, i) => { const meta = chart.getDatasetMeta(i); if (!meta.hidden) { meta.data.forEach((bar, index) => { const value = dataset.data[index]; let formattedValue; // Get the symbol for the given label index
const currentLabel = labels[index] ? labels[index] : labels[labels.length-1]; // Formatting a value with a symbol formattedValue = value + currentLabel const x = bar.x; const y = bar.y - 5; ctx.save(); ctx.fillStyle = 'black'; // text color ctx.font = 'bold 12px sans-serif'; ctx.textAlign = 'center'; ctx.textBaseline = 'middle'; ctx.fillText(formattedValue, x, y); // we display the label just above the column ctx.restore(); }); } }); } }; /* We check if there is a plugin block in the graph configuration if not, we create it */ if (!MyChart .config.plugins) { MyChart .config.plugins = []; }; // Check if this plugin has already been added
const pluginExists = MyChart .config.plugins.some(plugin => plugin.id === MyPlagin.id); if (!pluginExists) { MyChart .config.plugins.push(MyPlagin); }; // Updating the schedule MyChart .update(); |
To write your own functions and plugins, use the documentation chart.js https://www.chartjs.org/docs/latest/ Version 4.4.7
|