
pvvPlaginLabelBarLineChart
Plugin for displaying point values on a graph, for bar and line charts.
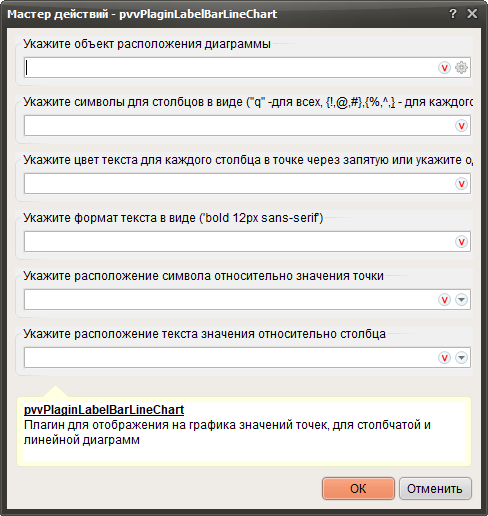
1. Click and specify the container in which the chart will be created.
2. Specify the symbols to be output together with the values (optional).
- "" - without using symbols, only the values are output
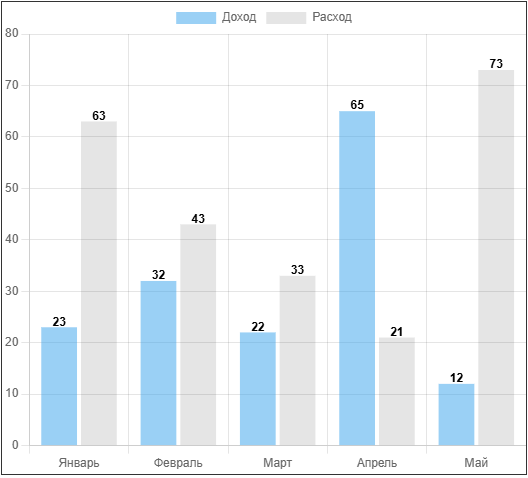
- '$' - The symbol will be applied to all columns
2. Specify the symbols to be output together with the values (optional).
- "" - without using symbols, only the values are output
- '$' - The symbol will be applied to all columns
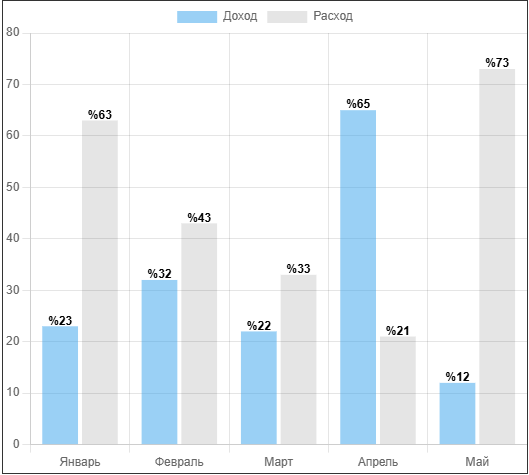
- '!,@,#,$,%' - Symbols will be applied to columns at each point.
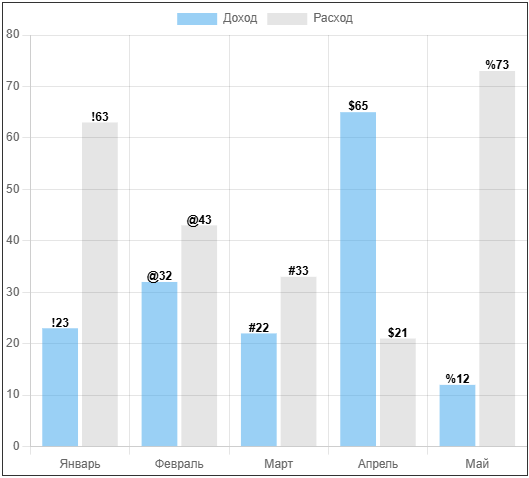
- '{!,@,#,$,%},{!!,@@,##,$$,%}' - symbols will be applied to the columns in each legend
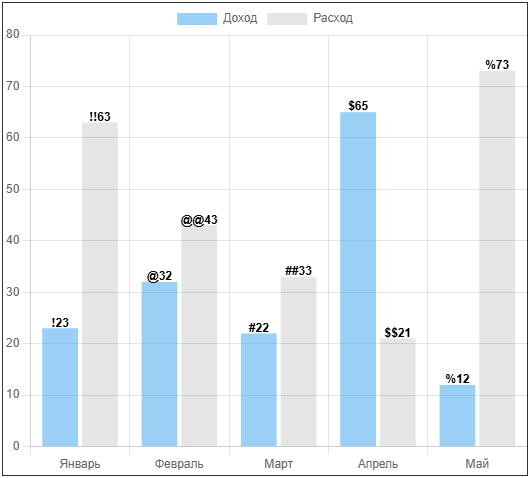
- '{$},{%}' - each symbol will be applied to all columns in each legend
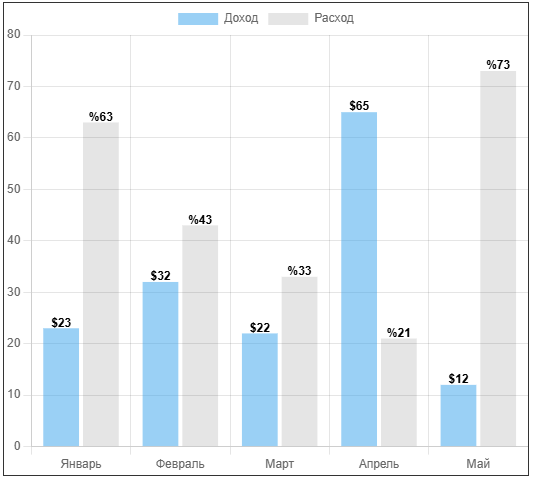
3. Specify the text color (one for all, separated by commas for each legend)
- 'red, green'
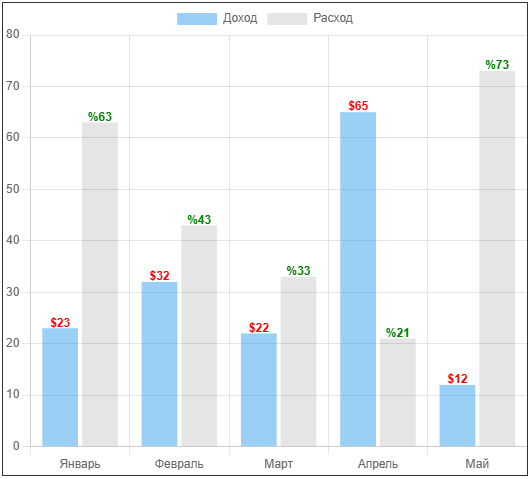
Color can be entered in two forms:
1. red 2. #254736 |
4. Specify the text format as (optional).
- 'bold 12px sans-serif'
5. Specify the symbol position relative to the point value (optional).
- Before
- After
6. Specify the value text position relative to the column (optional).
- Top
- Middle
- Bottom
For the line chart, the same order applies.
|