
pvvPlaginLabelCircularChart
Plugin for displaying values on pie, donut and polar charts.
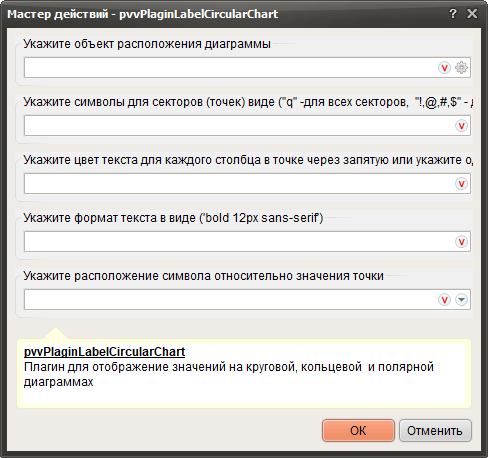
1. Click and specify the container in which the chart will be created.
2. Specify the symbols to be output together with the values (optional).
- "" - without using symbols, only the values are output
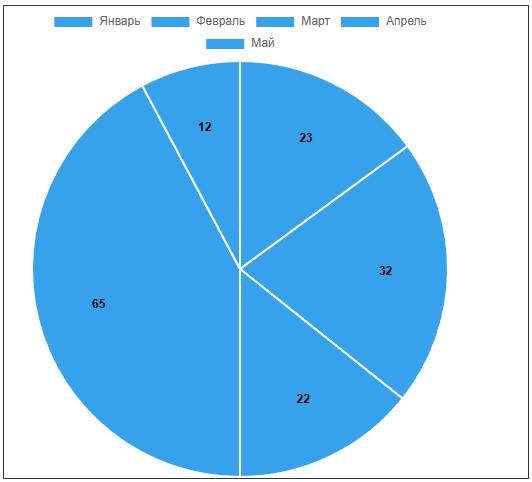
- '%' - The symbol will be applied to all sectors.
2. Specify the symbols to be output together with the values (optional).
- "" - without using symbols, only the values are output
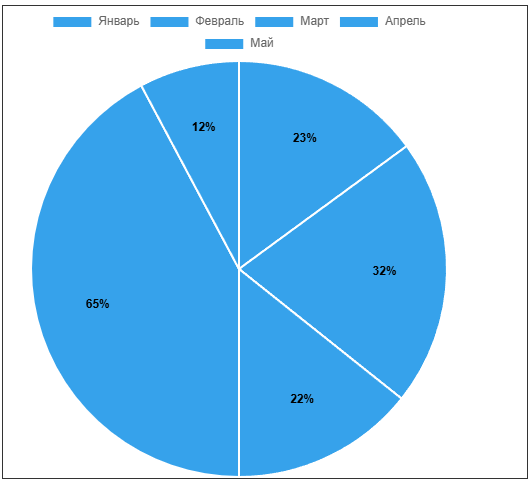
- '%' - The symbol will be applied to all sectors.
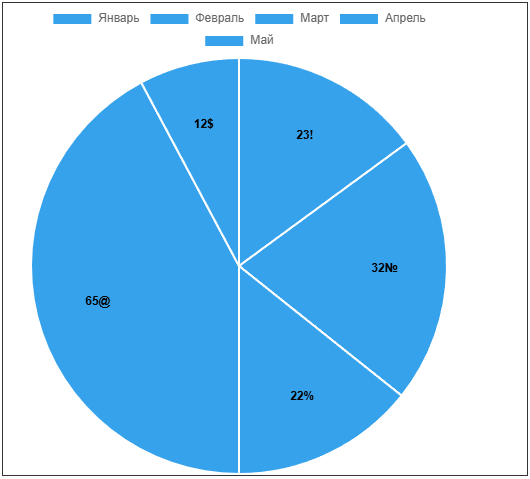
- '!,№,%,@,$' - Each symbol will be applied to its own sector.
3. Specify the text color (one for all, separated by commas for each sector)
- 'red,green,purple,#FD5308,#A0522D'
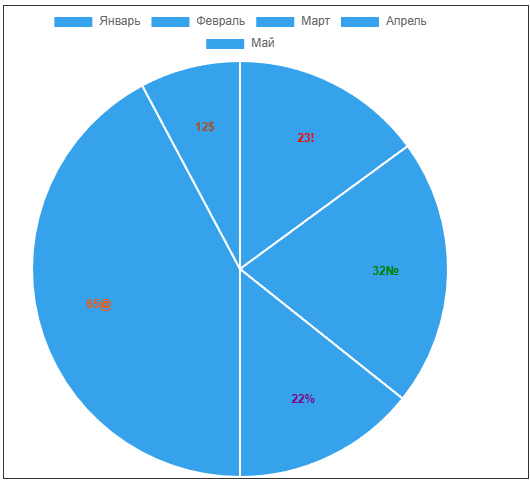
Color can be entered in two forms:
1. red 2. #254736 |
4. Specify the text format as (optional).
- 'bold 12px sans-serif'
5. Specify the symbol position relative to the value (optional).
- Before
- After
The same procedure applies to ring and polar diagrams.
|